What this is.
Opinion + Experience + Fact (35% opinion · 45% experience · 15% fact · 5% fiction)
Written in collaboration with AI — I discuss, I do not outsource.
Chapter 1. The Bug That Took Six Weeks
A few migrations back, I sat next to a brilliant firmware engineer chasing one bug for six weeks 🪲.
The product was a connected sensor — battery-powered, cellular, certified for a regulated industry. The bug happened in the field, once every few thousand hours. It produced a single line in the serial log: ERROR: timeout. No timestamp. No state context. No prior events. Just that line, written by a printf the original author had added on a Friday afternoon, three years and four engineers earlier.
The engineer was the best I had worked with in years. He methodically added more printf calls, reflashed the device, redeployed the firmware to the field, and waited. Three weeks for the bug to surface again. Three more weeks to narrow it down to a stack collision in a fault handler. Six weeks of one engineer's time for a single line of context.
The fix took two hours.
That six-to-one ratio — weeks spent finding a bug for hours spent fixing it — is the shape of firmware debugging in 2026 ⚖️. I have watched it on a dozen products. It is the largest hidden cost in the field. And the move that changes it is built into the architecture, not into the tooling.
The hook from the last post was about this exact move: every migration story I've watched ship has one move that pays back harder than the rest — observability built into the layer itself, before the first sensor read.
This post is what that move actually looks like.
▸ First principle. The cost of finding a firmware bug is many times the cost of fixing it. Observability is what changes the ratio.
Chapter 2. Where Printf Came From
Printf is one of the most quietly useful tools in firmware history 🛠️.
It runs on every chip. It costs nothing to add. It produces output a human can read. For three decades it has been the first instrument every embedded engineer reaches for when something is off. It earned its place the honest way — by being the cheapest way to see what the device is doing right now.
I have shipped products where printf was enough. A motor controller on a small batch. An evaluation board that ships with a USB serial connection. A bootloader that runs for a few seconds at power-on. For these, printf is a clean fit. The device is in front of you. The bug surfaces in seconds. The fix lands in minutes.
The honest tribute to printf is that it carries a class of work it was perfectly designed for. The next step is what that class stops being.
▸ First principle. Printf is the right tool for the work it was designed for. The question is what work outgrows it.
Chapter 3. The Edge Where Printf Strains
Printf reaches its edge in three predictable places 📍.
Volume. When the firmware logs more than a few events per second, the serial line saturates, the text becomes unreadable, and the engineer adds a filter if to silence the noise. The filter then hides the next bug. The volume keeps growing as the product grows.
Context. When the bug needs the state machine's last three transitions to reproduce, printf has to be told to print them. The engineer adds the call. Three weeks later, a different bug needs different context. Another printf. Six months later, the codebase has a thousand of them, each one telling a different story, none of them queryable.
Field. When the device leaves the bench, the serial line goes with it. The next log the team sees is a single line in a CSV the customer support team copied out of a portal. The printf that told the bench engineer everything tells the field engineer nothing.
These three edges arrive on every product at some point. The earlier the product ships at scale, the earlier the team meets them. The cost is rarely visible until the cost has already been paid 💸.
▸ First principle. Printf strains at volume, at context, and in the field. Every product meets these three edges. The earlier, the more they cost.
Chapter 4. What The Step Looks Like
Observability is the structural step past printf. It is one shift, made once, that changes the rest of the project.
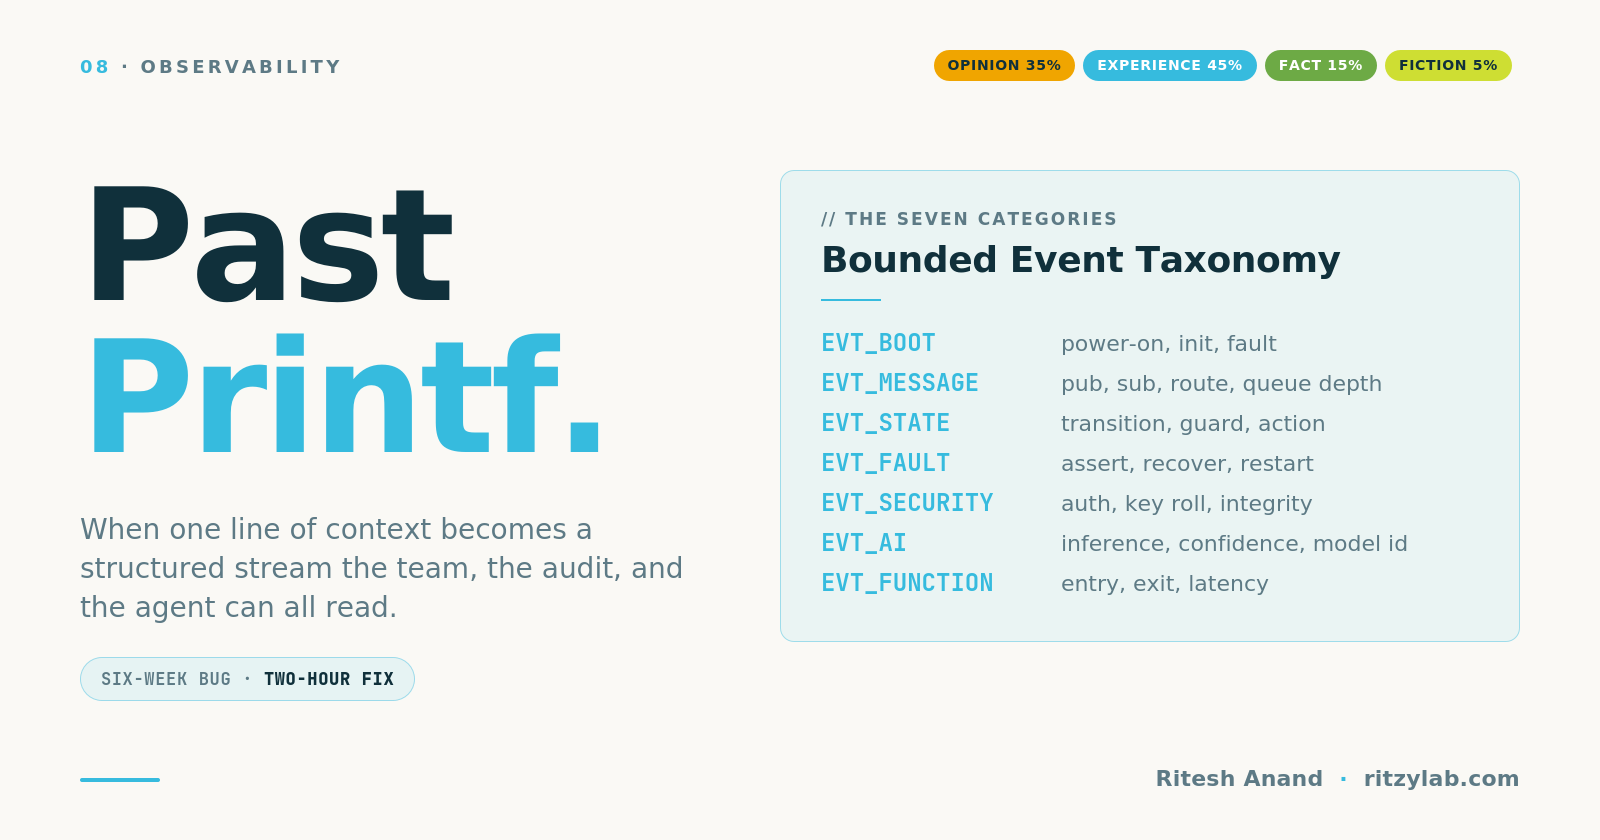
The shift is from free-form strings to a bounded event taxonomy 📚. The taxonomy is the architecture artifact from the previous post — a small list of event categories every team can hold in their head:
EVENT_BOOT       — power-on, init, ready, fault
EVENT_MESSAGE    — pub, sub, route, queue depth
EVENT_STATE      — transition, guard, action
EVENT_FAULT      — assert, recover, restart
EVENT_SECURITY   — auth, key roll, integrity check
EVENT_AI         — inference, confidence, model id
EVENT_FUNCTION   — entry, exit, latency
Seven categories. Each one has a typed payload. Every event carries a timestamp, a module id, and the same shape of context.
The events are written once, in the layer above the RTOS, the same way the message contracts and the FSM tables are written. The application code calls them — EVT(STATE, motor, RUN → IDLE, "load_below_threshold") — and the layer decides where they go. To a serial port in development. To a ring buffer in production. To a cloud sink under audit. The application code stays the same regardless.
Two things change immediately for the team 🎯:
The bug that lived for six weeks now surfaces in six minutes — the state transitions, the message payloads, the fault context, all already in the log because the layer captures them by default.
The audit conversation stops being a scramble — the event taxonomy is what IEC 62304, ISO 26262, and the EU AI Act all ask for, written down already, queryable already.
▸ First principle. Observability is not more printf. It is a bounded event taxonomy written once and captured by default.
Chapter 5. The Step In One Side-By-Side
Here is the same bug investigation in two columns. Left column: printf code added during the six-week chase. Right column: the equivalent in a bounded event taxonomy.
═════════════════════════════════ PRINTF ═════════════════════════════════
printf("ERROR: timeout\n");
printf("DBG: state=%d evt=%d\n", st, ev);
printf("DBG: queue depth %d\n", qd);
printf("DBG: motor i=%d v=%d\n", curr, volt);
printf("DBG: last_msg src=%d type=%d\n", msg.src, msg.type);
printf("DBG: heap free %d\n", xPortGetFreeHeapSize());
printf("DBG: faulted in fn %s line %d\n", __func__, __LINE__);
printf("DBG: stack high water %d\n", uxTaskGetStackHighWaterMark(NULL));

═══════════════════════════════ OBSERVABILITY ════════════════════════════
EVT_FAULT(motor, FAULT_TIMEOUT, "rotor_lock", &fault_ctx);
EVT_STATE(motor, RUN, IDLE, "load_below_threshold");
EVT_MESSAGE(bus, PUB, motor_cmd, &cmd, qd_depth());
EVT_FUNCTION(motor, ENTRY, motor_recover, latency_us());
EVT_BOOT(system, MEMORY, free_heap(), stack_hw_mark());
Eight printf calls become five typed events. The events are queryable — every EVT_FAULT in the last week, every state transition where the guard was load_below_threshold, every EVT_MESSAGE with queue depth above a threshold. The serial line that took the engineer six weeks to read becomes a structured stream a tool can search in seconds.
The work each engineer does on the next bug becomes additive, not redundant. The bug already has its own breadcrumbs in the log because every state transition, every message route, every fault recovery has been emitting them all along 🍞.
▸ First principle. The same investigation, written through a bounded event taxonomy, becomes queryable, replayable, and additive across engineers.
Chapter 6. Why This Step Compounds
The reason this step pays back so hard is that it touches every other piece of the system 🌐.
When the layer above the RTOS publishes events, the team's mental model becomes the same as the runtime's actual behavior — for the first time. The senior engineer's intuition turns into an event stream the new hire can read. The bug the customer reports becomes a query against the last 30 seconds of structured events the device captured before it restarted.
The AI agent in the loop reads the same stream and proposes the next module. The audit body asks for traceability and gets a stream that already has the shape its checklist asks for. The QA engineer writing the next test case asserts on EVT_STATE instead of grepping a free-form log.
This is the move every migration story I've watched ship has — observability built into the layer itself, before the first sensor read. The move was the answer to the hook of the last post. The next post picks up the architectural decision that decides how cleanly the observability layer scales.
▸ First principle. Observability built into the layer is the move that compounds across every other architectural choice a team makes.
Chapter 7. What I Would Add This Sprint
If I were on a firmware team this Sunday evening, here is the single change I would make this week 📌.
Pick one module — the one with the most printf calls. Define the four most common event categories that module emits: BOOT, STATE, MESSAGE, FAULT. Write a one-page taxonomy for each — what the typed payload looks like, where the event goes by default, who reads it.
Replace the printf calls in that one module with calls into the event taxonomy. Keep the printf surface for the rest of the codebase. The team will see the queryability difference in one sprint, on one module, before deciding how widely to roll it out.
The cost is a few days. The payoff is one fewer six-week bug per quarter. Most teams I have worked with have a backlog of three or four such bugs sitting in the issue tracker right now, waiting for someone to figure out where to add the next printf 🎯.
If your team replaced every printf in one module this week — which module would you start with, and what is the bug the new taxonomy would catch?
Next: when observability is built in, one architectural choice decides how cleanly the system scales — message-driven or shared state. Both compound, in opposite directions.
▸ First principle. The step from printf to observability is one module, one week, one sprint. It pays back the rest of the project.
Labeled: Opinion + Experience + Fact (35% opinion · 45% experience · 15% fact · 5% fiction)
Sources:
- Previous post — After Mbed OS: Choosing the Architecture That Outlasts Your RTOS — the architecture above the RTOS as the part that compounds across migrations
- Earlier post — The Layer Above Your RTOS Has a Name — the five elements of the application architecture layer, one of which is the observability event taxonomy
(Written in collaboration with AI — I discuss, I do not outsource.)
New to this labeling? Read the framework → 20+ Years of Ideas. Articulation Is the Craft.
— Ritesh | ritzylab.com
#EmbeddedSystems #Observability #Firmware #Debugging #FirstPrinciples
Stay in the loop
New essays on embedded systems, firmware quality, and engineering craft. No noise.
Discussion
No comments yet. Be the first to share your thoughts.
Leave a comment